PLANTS MODELED16,800+
DISPATCH ACCURACY±5% vs EQR actuals
VERIFIED COMPS564+
LTM M&A VOLUME$68.8BSince 2020
LTM AVG $/KW$808/kW
PE & INFRA FUNDS276 active
POWER MARKETS7 ISOs covered
CURVESICE daily (coming soon)
CLOSEDFort Duncan Battery Energy S
CLOSEDAdams Solar LLC, Northumberl
PLANTS MODELED16,800+
DISPATCH ACCURACY±5% vs EQR actuals
VERIFIED COMPS564+
LTM M&A VOLUME$68.8BSince 2020
LTM AVG $/KW$808/kW
PE & INFRA FUNDS276 active
POWER MARKETS7 ISOs covered
CURVESICE daily (coming soon)
CLOSEDFort Duncan Battery Energy S
CLOSEDAdams Solar LLC, Northumberl

The M&A Terminal for
U.S. Power Infrastructure

The ownership, transaction, and market intelligence platform for North American power infrastructure. 276 sponsors. 16,800+ assets. 564+ verified transactions. Dispatch modeling and ISO analytics. Built by power M&A bankers and investors.

Direct ownership · indirect via platform · pending corporate actions · capital sources · transaction comps · dispatch engine · ISO market intelligence · 7 ISOs covered.

EIA 923 · 860·FERC 203 FILINGS·SEC · EDGAR·EQR BACKTESTED·UPDATED DAILY
16,800+
Power Plants MappedCCGT · Coal · Nuclear · Hydro · Solar · Wind · Storage
276
PE & Infra FundsDirect + indirect via platform
564+
Source-Verified Transactions3+ independent filings per comp
$68.8B
LTM M&A Volume+3.7% YoY
64
Pending Corporate ActionsAnnounced acquisitions & divestitures

One Terminal. Every Data Point in North American Power.

Built by infrastructure bankers and investors. 16,800+ assets. 564+ source-verified transaction comps. 7 ISOs. Updated daily from primary sources.

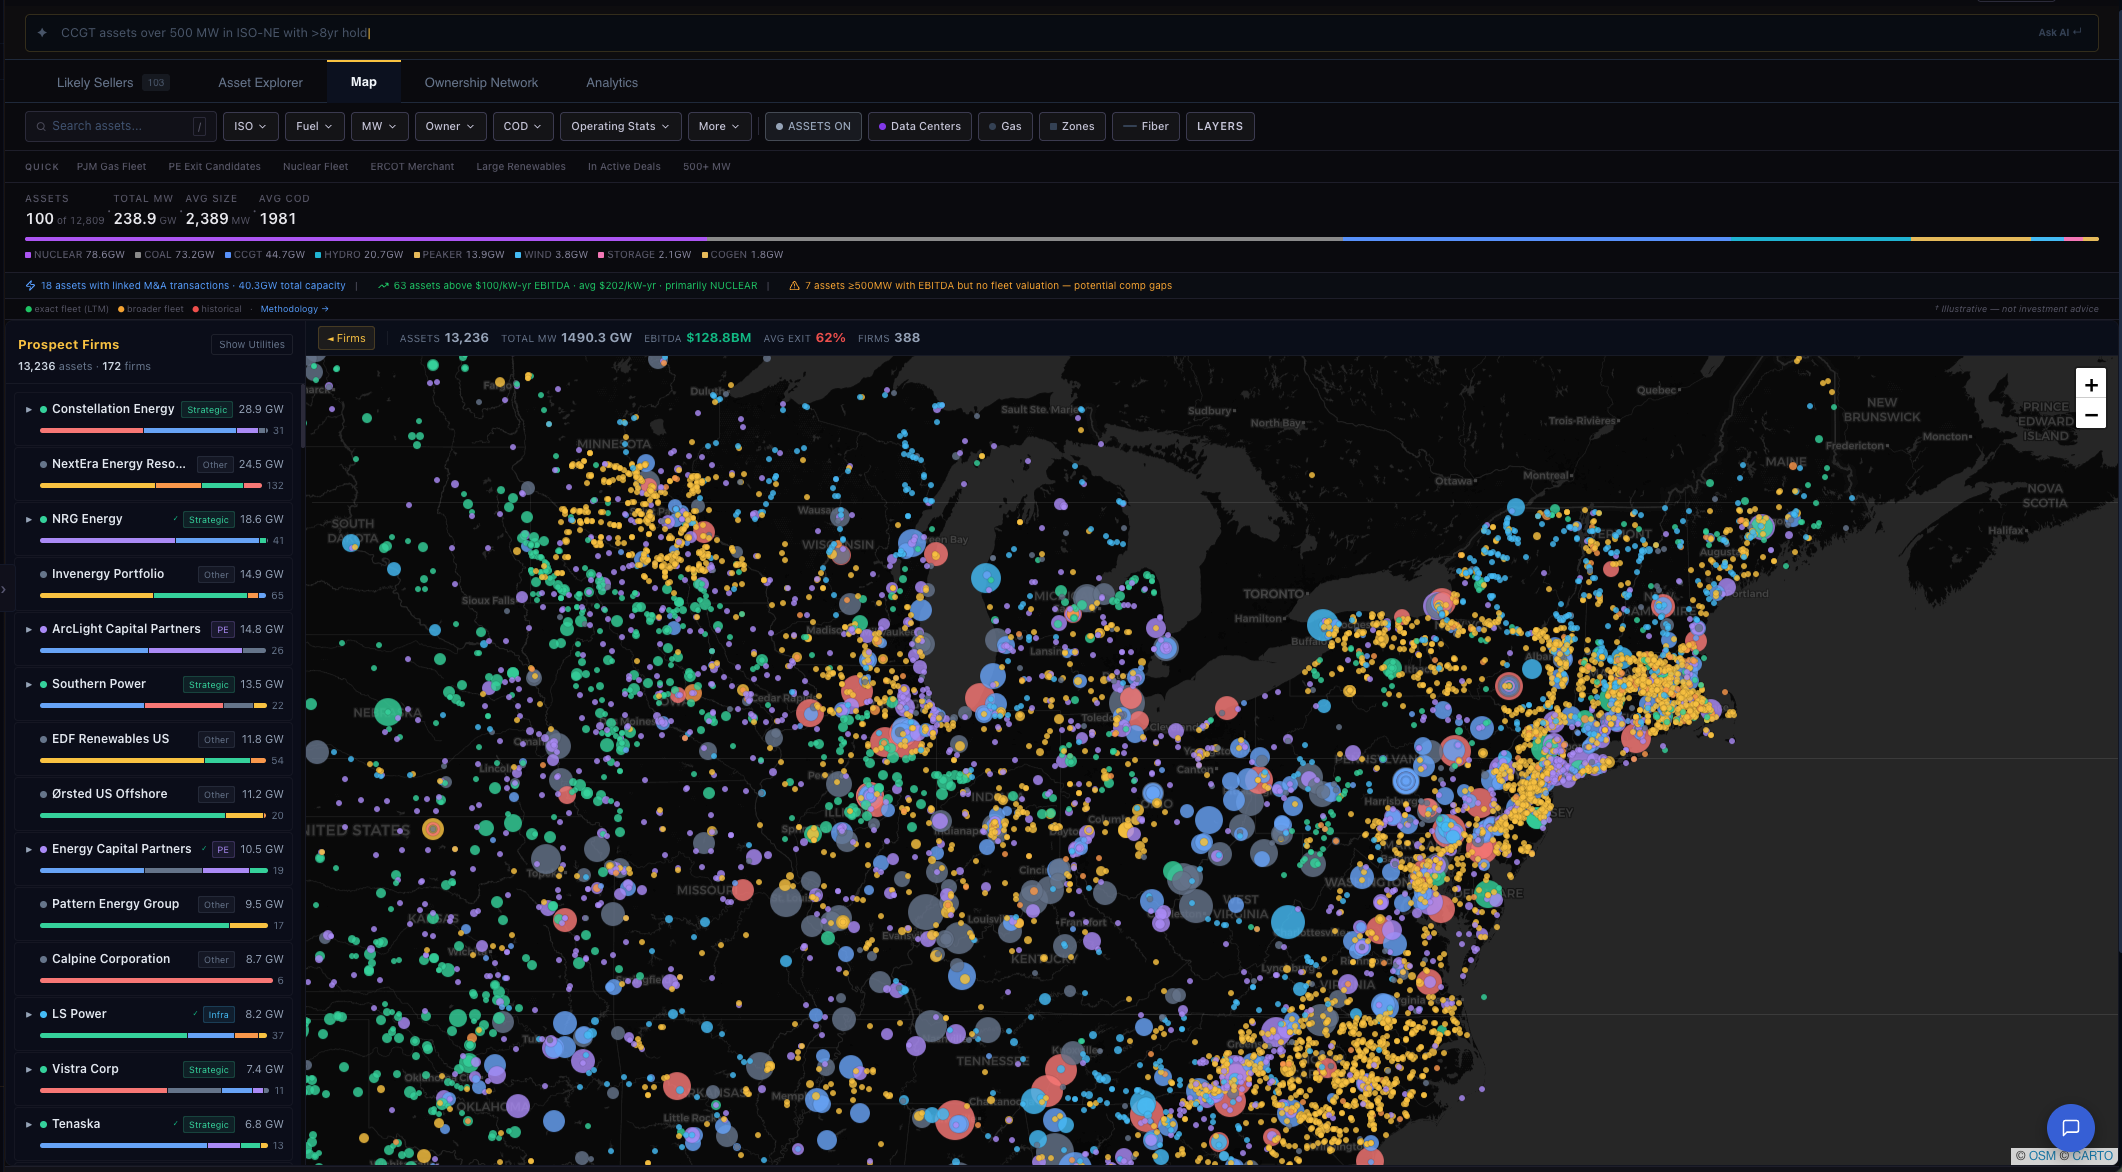
Origination & Ownership Intelligence

Algorithmic origination engine: scores every PE-owned plant by fund lifecycle, hold period, portfolio concentration, and market timing — ranks qualified buyers by mandate fit, check size, and recent deployment
Ownership graph: interactive network of 276 PE and infrastructure funds, their platforms, operators, and 16,800+ assets — sponsor → platform → asset in one view
Capital deployment tracking: who’s raising, who’s deploying, who’s in harvest mode
Real-time deal flow from FERC 203 filings with AI-scored strategic rationale and buyer commentary
ISO market intelligence: 100+ sections of power market analysis across PJM, MISO, ERCOT, CAISO, NYISO, ISO-NE, and SPP

Verified Transaction Comps

564+ verified power M&A transactions — sourced from FERC 203 filings, SEC 8-Ks, and primary deal documents. Not a black box
$/kW and EV/EBITDA by ISO, asset type, vintage, and buyer/seller type — filterable in seconds, exportable to Excel
Buyer and seller identity aggregated and fuzzy-matched across FERC, SEC, press, and trade sources — every counterparty verified against 3–5 independent records before entering the comp set
Buyer/seller league tables: deal count, aggregate MW, and median $/kW for every active sponsor and strategic
FERC 203 filings and press releases scraped daily — new transactions added automatically when EC dockets are filed or deal announcements hit the wire

Dispatch Intelligence

8,760-hour hourly dispatch for thermal generation (CCGT, peakers, coal) and battery storage — LP optimizer, plant-specific heat rates from EIA 923, backtested against EQR 10-K actuals
Monte Carlo price simulation: 500 forward price path scenarios per plant, generating a full P10–P90 distribution of energy margin outcomes — uncertainty quantified, not averaged away
Backtested within ±5% of EQR 10-K actuals across 1,000+ thermal plants — calibrated mean error +$1.57/MWh, MAE $4.37/MWh
Battery storage: LP arbitrage optimizer with SOC constraints, round-trip efficiency modeling, and Monte Carlo revenue distribution across 500 simulated price paths

Institutional-Grade Output.

Asset Map

16,800+ U.S. power plants mapped by owner, fuel type, and sell signal. 2,167 PE-owned assets — filterable by ISO, fuel, MW, fund lifecycle, and data center proximity.

0+
Operating Assets Tracked
0
ISO/RTO Markets Covered
0+
Source-Verified Transaction Comps
0
Active Infrastructure Sponsors
0
PE-Owned Plants Mapped
Daily
Data Refresh Frequency

Primary Source Data.

Ownership Graph
EIA 860
Plant registry, capacity, ownership
FERC 203
Ownership changes, transaction filings
SEC / EDGAR
Fund disclosures, 13F filings
Transaction Comps
FERC 203 / Press
Deal flow, disclosed consideration
SEC 8-K
Public filing corroboration
Dispatch Model
EIA 923
Plant-level heat rates, generation history
FERC EQR
Hourly energy market actuals for backtesting
ICE FuturesComing Soon
Hub-level power & gas forward curves
Market Intelligence
PJM IMM (Potomac)
State of the Markets · Annual Capacity Adequacy Report
MISO / NYISO / ISO-NE IMM
Potomac Economics · Astrapé (MISO external monitor)
ERCOT · CAISO · SPP
Market monitor reports and annual state-of-market
Ownership graph & buyer/seller match

Ownership tracked at the direct asset level and the platform level — fund → platform → asset in one graph. InfraComps scores every PE-owned plant by fund lifecycle, hold period, and market timing to surface likely sellers. Qualified buyers are ranked by mandate fit, check size, and recent deployment. Structures like ECP → Calpine or ArcLight → Alpha Generation are mapped across all 276 active sponsors.

Transaction comps & screening

Every comp corroborated by 3+ independent public filings — FERC Section 203 applications, SEC 8-K disclosures, press releases, and trade press. Filterable by ISO, fuel type, buyer/seller type, vintage, and deal structure. $/kW and EV/EBITDA shown only where reported or directly implied from confirmed deal data — never estimated.

Dispatch model

8,760-hour hourly dispatch simulation for every U.S. power plant — CCGT, coal, nuclear, hydro, renewables, and storage — using plant-specific heat rates from EIA 923. Monte Carlo simulation generates 500 price path scenarios per plant to produce a full P10–P90 distribution of energy margin outcomes. Backtested within ±5% of EQR 10-K actuals across 1,000+ plants.

ISO market intelligence

100+ sections of power market analysis sourced directly from Independent Market Monitor reports — Potomac Economics covering PJM, MISO, NYISO, and ISO-NE; Astrapé for MISO; ERCOT ORDC analysis; and ISO-equivalent annual market reports for CAISO and SPP. Capacity auction results, energy market regime analysis, and deal signals updated as reports are published.

Request Early Access

A 30-minute session covers origination screening, verified comp analysis, and dispatch modeling — on a deal, asset, or sponsor in your current coverage universe.

Request a Demo